Creating date tables in Power BI
If you want to analyze data over time, there is probably no more important table for a Power BI model than a correct date table. In this tutorial, we will show you the fastest and most effective way to create a detailed date table with DAX.
Date tables in Power BI are tables that contain only date-related data and are used to perform date- and time-based analyses. With date tables, you can break down your data by date attributes such as days of the week, weeks, months, quarters or years. This also allows you to use time intelligence functions.
Date tables are also known by other names. These include, for example, calendar table, date dimension table and calendar dimension table. All these names refer to the same thing: a table with one data record per day and a column that displays the attribute of the date. When using date tables, all columns must be formatted correctly to enable correct analysis.
Rules for a date table:
- At least one date column with the date/time data type
- No data may be missing in the date column
- The date column must be marked as a date table
- A date column should not contain any spaces
- A date column must have unique value
Create a date table with DAX
One method of creating a date table in Power BI is to use DAX. An introduction to DAX can be found here. It is the best solution for beginners as many of the functions in DAX are similar to the date and time functions in Excel.
The CALENDAR function is often used to create a date table. This returns a date range based on the specified start and end dates. The start date is the date furthest away from the latest end date.
To use the CALENDER function, navigate to the “Home” tab in the ribbon in Power BI Desktop.
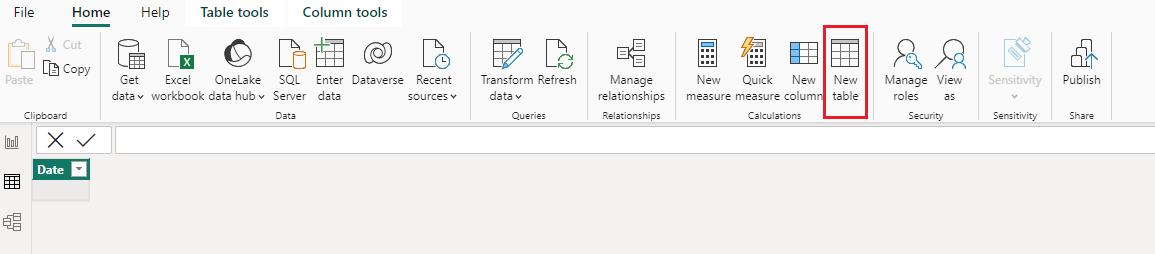
Select “New table” and then enter the DAX formula as shown below. You must insert your own data. However, the YYYY/MM/DD format must be observed.
This content is locked
Login To Unlock The Content!