
4 Unexpected Charts You Can Create with Power BI Error Bars (without Custom Visuals!
Power Bi’s traditional bar charts & standard chart options often restrict you in effectively communicating key data insights. Error bars customization opens up a new dimension of visualizations, enabling you to create unique and informative visualizations.
Primarily Error Bars allow you to track uncertainties in your data sets, recently Microsoft has added some custom elements into it, these enhancements have transformed error bars into a powerful tool to create new chart types – all this is possible without relying on the additional custom visuals.
This blog will guide you exploring four unique chart variations that you can create entirely within Power BI using error bars, without relying on additional custom visuals.
- Lollipop Chart
- Dumbbell Chart
- Two toned Lipstick Chart
- Lollipop & Bar Combo Chart
These creative visualizations add a touch of fun and enhance clarity & audience engagement.
By the end of this 5 mins read you will be able to create, 4 unique charts using error bars as shown on the dashboard
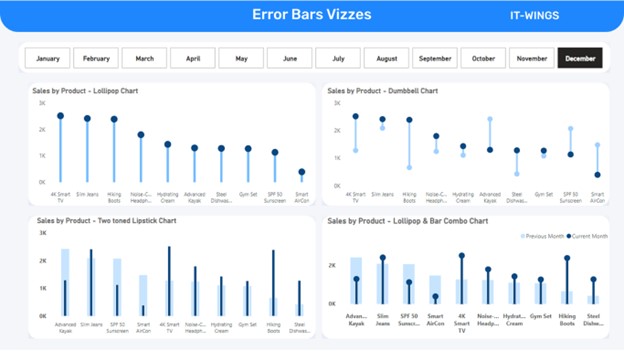
Chart 1 – Lollipop Chart
This content is locked
Login To Unlock The Content!