In today’s data-driven world, accessing and efficiently processing large amounts of data is crucial. In this blog post, you will learn how we at IT-WINGS prepare Google Analytics 4 (GA4) data with Python Pandas and calculate important key performance indicators (KPIs) with Pandasql. We also explain the use of Pandasql and show the calculation of the conversion rate as an example of a KPI.
1. Data retrieval from BigQuery
BigQuery is a powerful platform for processing big data. We receive all raw data from GA4, which serves as the basis for our analyses, via the export from BigQuery. To continue working with the raw data in Python, the data is queried via an API after export. There are numerous blogs on how exactly this export works. As this blog is not intended to be about this, it will not be discussed further and we recommend that you do some independent research.
2. Data cleaning and preprocessing with Pandas
The data we receive is raw and unstructured. We use Pandas to cleanse and prepare the data. The Pandas functions can be used for the following, for example:
- Removal of unnecessary data
- Addition of important data
- Connection of important data
These preparations are crucial for later analyses.
Example of using a Pandas function to concatenate two DataFrames:
					for df_name, df_data in dict_df.items():
     df_geo = pd.concat([df_geo, df_data[geo_data]], ignore_index=True)
Here you will find a list of all the functions of Pandas.
3. Splitting data for performance optimisation
To enable efficient processing of the data, it is important to split the data separately into Panda’s DataFrames. This makes the data more accessible for specific analyses and queries and increases the processing speed.
Example for the creation of a separate DataFrame for geo data:
					# generate dataframe for geo data

geo_data = ['unique_eventID', 'geo_continent', 'geo_country', 'geo_region', 'geo_city', 'geo_sub_continent', 'geo_metro']
df_geo = pd.DataFrame(columns=geo_data)

for df_name, df_data in dict_df.items():
     df_geo = pd.concat([df_geo, df_data[geo_data]], ignore_index=True)
4. Saving data in databases
The separated tables are stored in a database so that the pre-processed data remains accessible for future analyses and queries. This also enables easier integration with other data sources and systems.
Example of saving geo data in a database:
					# loading data into the database

table_name = 'silver_ga_geo'

df_geo.to_sql(name=table_name, con=engine, if_exists ='append', index= False)
5. Use of Pandasql for KPI calculations
An important step in the process is the calculation of KPIs: We use Pandasql to retrieve various KPIs from our pre-processed data. But why Pandasql?
Pandasql provides a seamless integration of SQL queries into the Pandas library. This allows us to utilise the powerful SQL syntax to perform complex queries on our data while benefiting from the data processing capabilities of Pandas. This combination makes Pandasql the ideal choice for our KPI calculations.
Here you can find information about Pandasql.
6. Calculation of the conversion rate
An example of a KPI that we calculate with Pandasql is the “conversion rate”. This was calculated as follows:
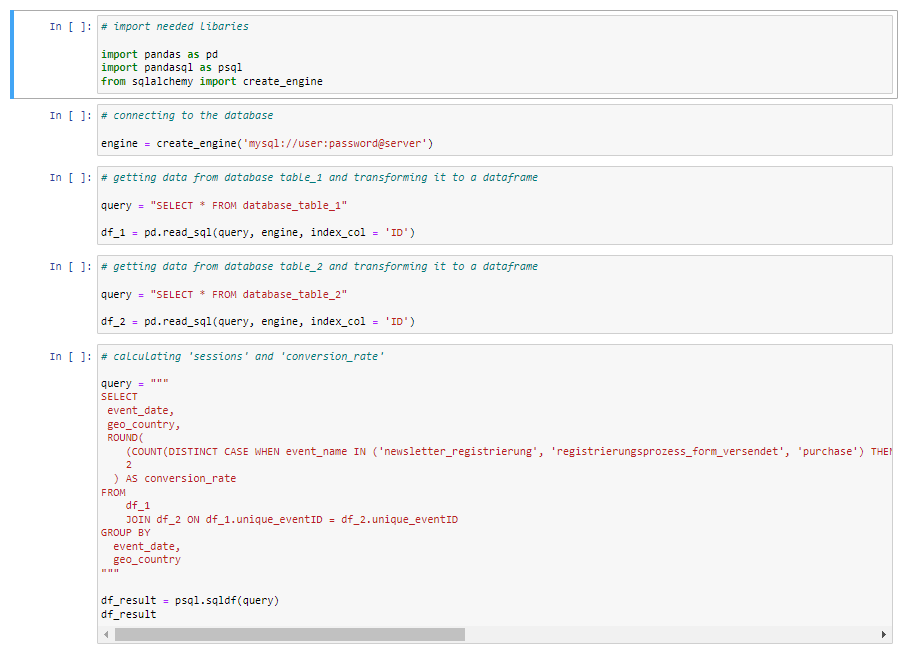
- We import the required libraries.
- We establish a connection to the database in which our raw data is stored. For this we use SQLAlchemy, a Python SQL toolkit, as an example.
- We query our required data via the database connection and store it in a Pandas DataFrame.
- Now we write our query to calculate the desired key figure. To do this, we combine the data from our tables with a JOIN clause. As a basis, we use a unique event ID that we have assigned to each data entry during preprocessing. In addition to the KPI, we also select the date and country, as we want to see these as dimensions. To calculate the conversion rate, we count unique events in which the conversion events we have defined occur. In this case it is a “purchase”, a “registration” or a “newsletter sign-up”. We divide this by the number of our sessions to get the desired conversion rate. We group by our dimension to get the desired visualisation.
- We create a DataFrame from the result, which allows us to further analyse and visualise the results and integrate them into our reporting and dashboards.
Simplified example for calculating the conversion rate:
In this blog post, we showed you how we at IT-WINGS calculate important GA4 KPIs using Pandasql. This process enables us to gain valuable insights from our data and make informed business decisions.
Pandas and Pandasql are powerful tools for data analysts and data scientists working with large data sets. They help us to process data efficiently and gain valuable insights.
We hope you found this insight into our data processing process useful. If you have any questions about the data handling process, we look forward to hearing from you. We will be happy to support you with your data analyses or the processing of important data. Stay tuned for more exciting articles on data analysis and processing at IT-WINGS!