Targeted budgeting of Google Ads campaigns is a decisive factor for successful online marketing. But what factors should be used to budget Google Ads campaigns? This blog post presents a model from IT-WINGS that helps to develop the optimal strategy for budgeting Google Ads campaigns based on data and with the help of machine learning.
Google budget recommendations
- Opacity: The budget presented by Google is non-transparent. It only presents a result in the form of a figure. It remains unclear how this figure was calculated or why exactly this value should be optimal.
- Lack of customisation options: The model offers only limited customisation options to meet an advertiser’s individual goals and needs. Each company has unique objectives, target groups and competitive factors that may not be sufficiently incorporated into the generic model.
- Limited data transparency: Advertisers have little insight into the quality and consistency of the data Google uses to make recommendations. This can lead to uncertainty, especially when advertisers need accurate and reliable information to make decisions.
- Unrealistic targets: Sometimes Google’s model simply suggests unrealistic values.
As a result, using Google’s recommended budget alone can lead to sub-optimal results, as it may not be precisely tailored to the individual needs and objectives of a particular business.
IT-WINGS has therefore developed its own model with which transparent, adaptable and targeted budget optimisation can be achieved.
Steps towards budget optimisation
The key of the model developed by IT-WINGS is an AI-based regression on data from the analysed Google Ads account. Before this can happen, however, the data must be extracted, analysed and processed. The resulting data is then collected and visualised. To optimise this process, IT-Wings has developed simple software with scripts to automate individual process steps. The steps involved in determining optimal campaign budgets are explained below.
1. Automated query
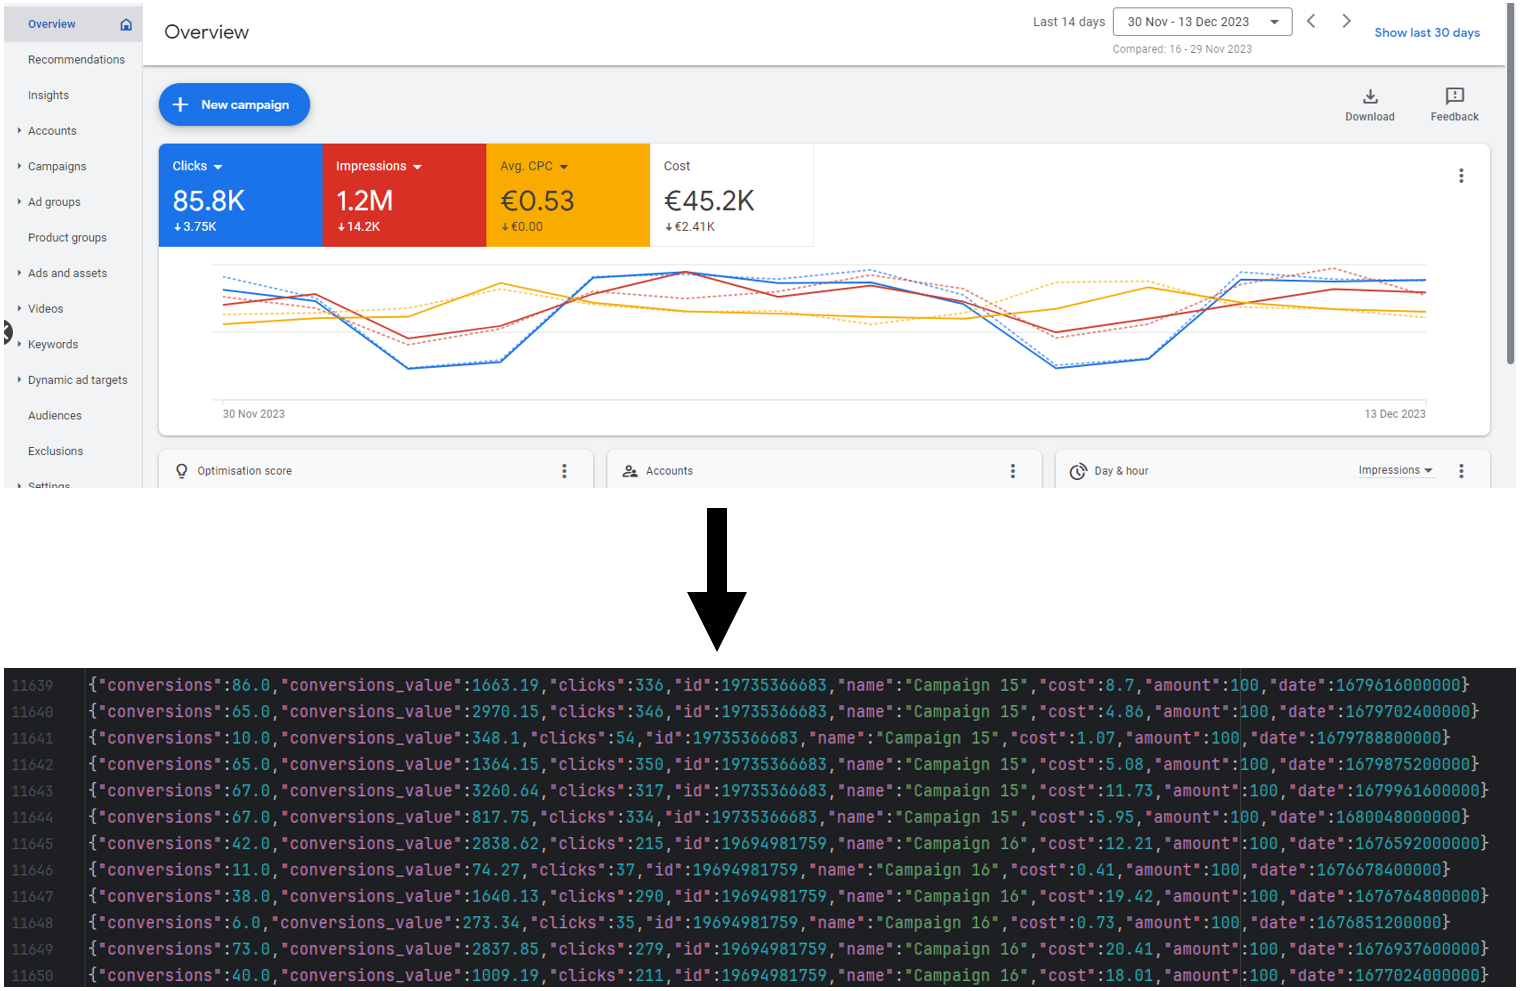
The first step is a fully automated query of the Google Ads account data. The query parameters are defined via a configuration file. Depending on the customer’s specific goal, certain metrics such as conversions, costs and CTR are collected with different granularity, for example at campaign or keyword level. For larger accounts, the data records can reach a size of many millions of lines, which are saved in the form of a JSON file. In the image below you can see the Google Ads account at the top and the raw data obtained from it at the bottom.
2. Data analysis and selection
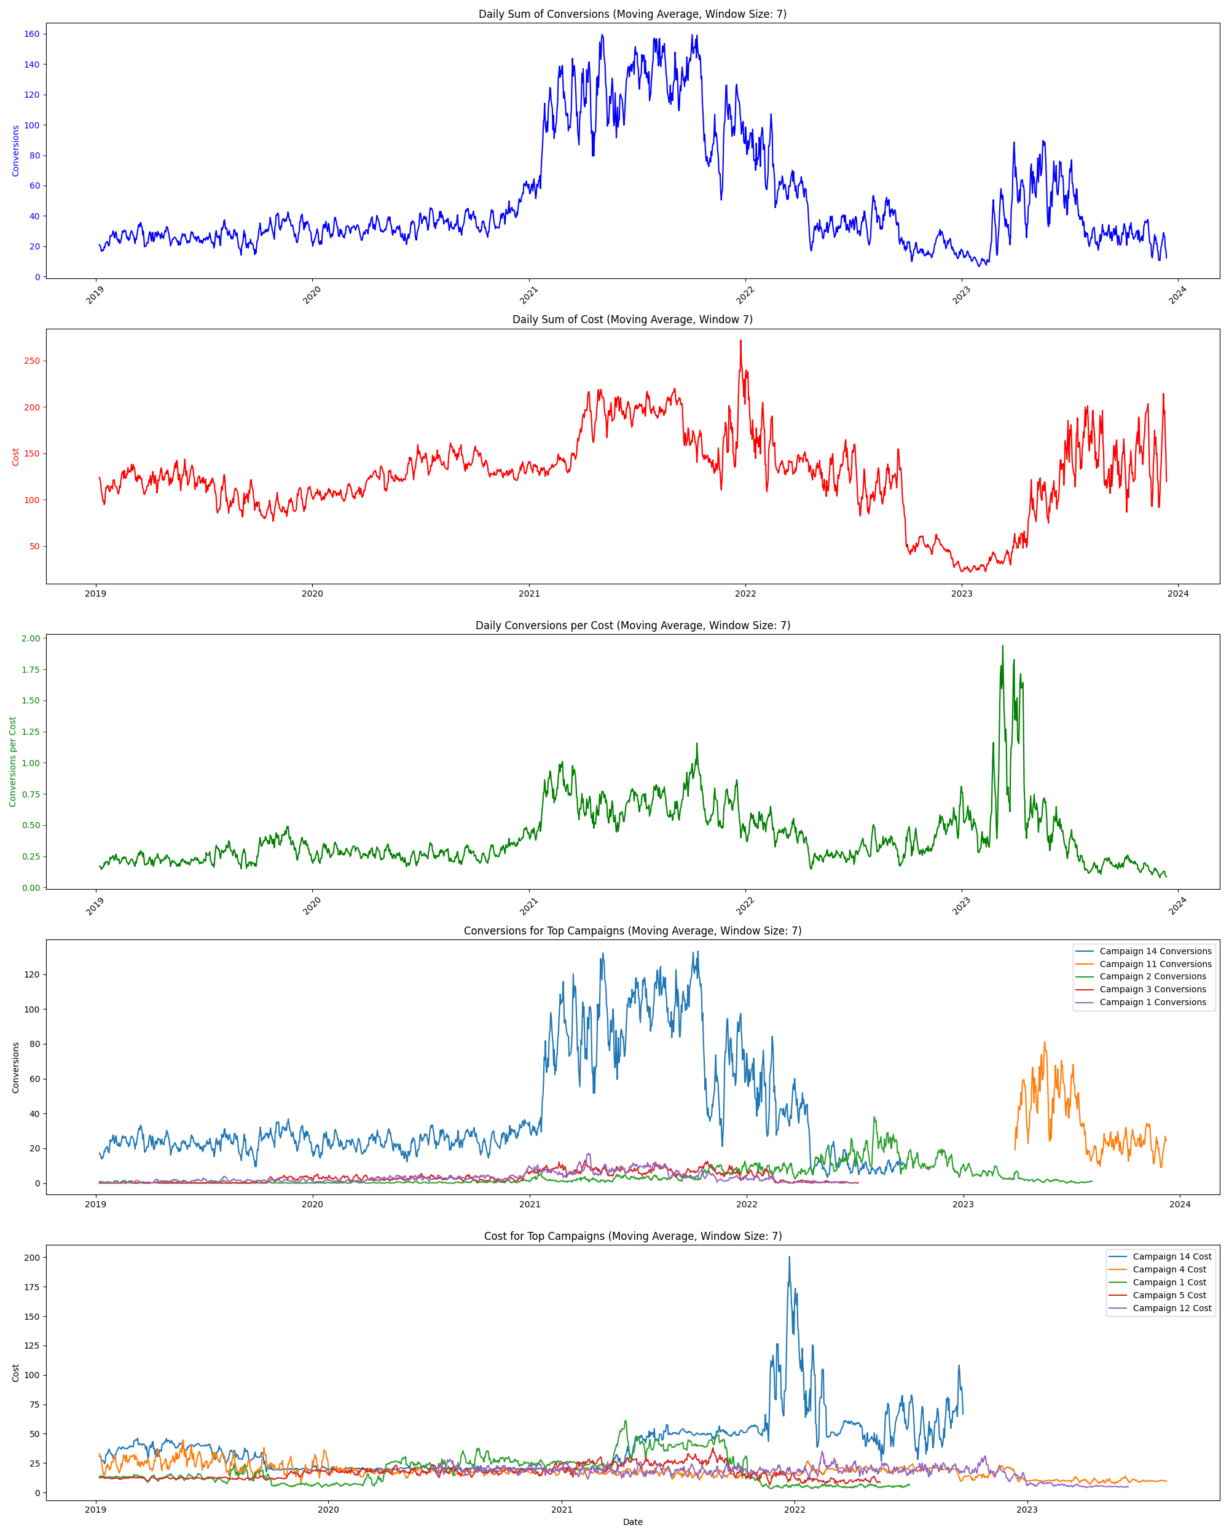
The basis of the model is a thorough analysis of the existing data. The model automates and optimises large parts of this step. Nevertheless, the expertise and market knowledge of the analyst using the model is crucial. Using the graphics generated by the model, he identifies trends, assesses data quality and consistency and also considers the influence of relevant market changes. Based on his analyses, he then selects the data that is suitable and relevant for training the model. Below are excerpts from the analysis of the raw data.
3. Modelling and regression
The selected data is now used to create the actual model. For this purpose, the time period of the data and a target value to be optimised are selected. These settings depend heavily on the client’s objectives. An example would be a company that wants to maximise its conversions with a well-performing account and is considering up to what value an increase in budget would result in a significant increase in conversions. In this case, conversions and costs would be important optimisation parameters. Firstly, the relevant data is pre-structured and then passed on to the model. The AI-based regression model then recognises trends in the data and determines an optimum for each campaign.
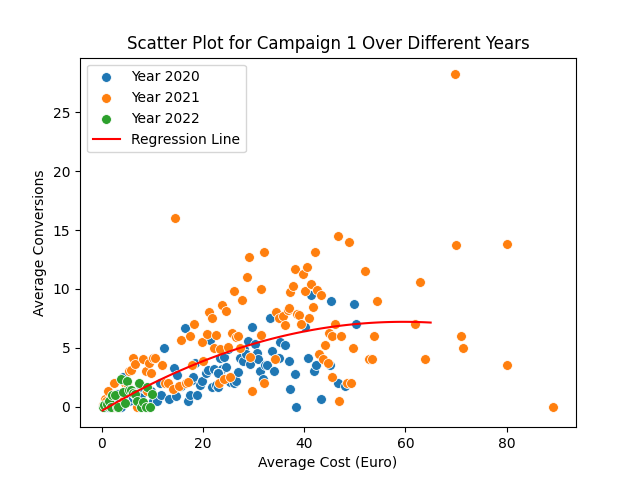
The figure shows the regression line created by the model. It depicts a relationship between costs and conversions based on historical data and provides information on how many conversions can be expected for a certain budget. In the example data shown, a trend can be recognised on the red line. This trend indicates a decreasing marginal benefit in terms of additional conversions due to budget increases in campaign 1. In simple terms, this means:
You can derive from the red line that almost 5 conversions can be expected with a budget of 20 euros. However, doubling the budget does not double the expected conversions.
Only about 2 conversions are added. The model recognises here that a significant increase in conversions can hardly be expected from a budget of 60 euros at the latest. With this trend, the model can determine an optimum at which it no longer makes sense to invest more money.
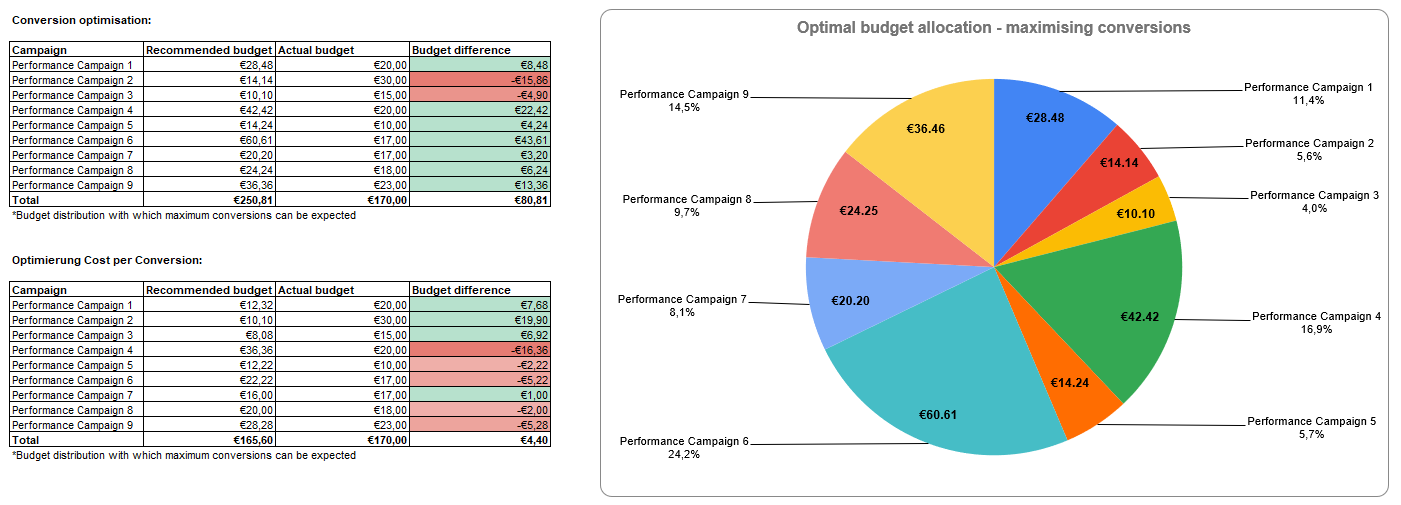
4. Results and adjustments
The results are summarised in a comprehensive table. Several optimisation approaches are often tried out and their results compared with each other, as in Figure 4. In addition to the previously presented strategy for optimising conversions, the results for a cost-efficient strategy by optimising the cost per conversion are shown there. This allows the results to be compared and it is possible to determine the optimum budget for each campaign.
Conclusion and prospects
Budgeting Google Ads campaigns is a complex task that requires data-based models in order to make accurate and individualised decisions. IT-WINGS masters this challenge by analysing raw data and applying statistical methods. This enables our clients to optimise their budgets and increase the success of their campaigns. The IT-WINGS model also enables in-depth, individual analyses of long-term trends, filtering of top campaigns and keywords according to specific criteria and individual optimisations at campaign and keyword level.
If your events are sent as requested, you can publish the GTM version and start collecting data.
If you have any further interest or questions about the IT-WINGS model, please do not hesitate to contact us!