Funnel analyses in Google Analytics 4
A funnel shows how users follow your website and/or mobile app to achieve certain goals (purchase, form submission, etc.). Funnels allow you to analyze problem areas on your website and identify optimization opportunities. They are also helpful to better understand user behavior. This type of analysis allows you to define specific users for future remarketing campaigns.
As a web analytics agency, it is of course very common to have to set up different funnels for clients. For this reason, the following shows how you can set up such a user-defined funnel yourself.
In Google Analytics 4, you can create funnels via the “Explorations” tab.

Let’s take a look at the individual steps of funnel creation in GA4 together:
After clicking on “Create a new report”, the report menu and the pre-selected metrics, dimensions and steps are displayed.

Funnel steps
To create your own steps, you need to click on the pencil icon.

You can add or replace funnel steps here
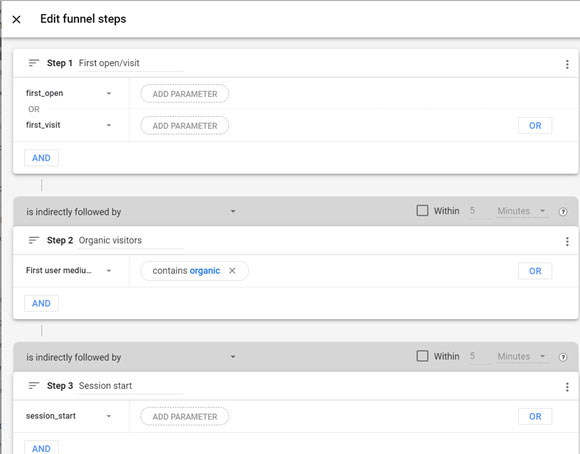
Below I will show you how to create an e-commerce funnel in Google Analytics 4.
We can keep “Session Start” as the previous step in our funnel. Or we can restrict this condition using filters under the “AND” button, for example, if we want to include users who started their session on the home page. If we need to filter by custom parameters, we can select the “Add Parameter” button.

We can also extend the step by adding conditions under the “Or” button. At this point it should be mentioned that the filters here are very flexible and you can set very specific conditions for the analysis.
You can remove or edit unnecessary steps. To create the next funnel step, click on the “Add step” button.
Two new options are displayed for the second and next step: “is indirectly followed by” and “Within 5 Minutes”.
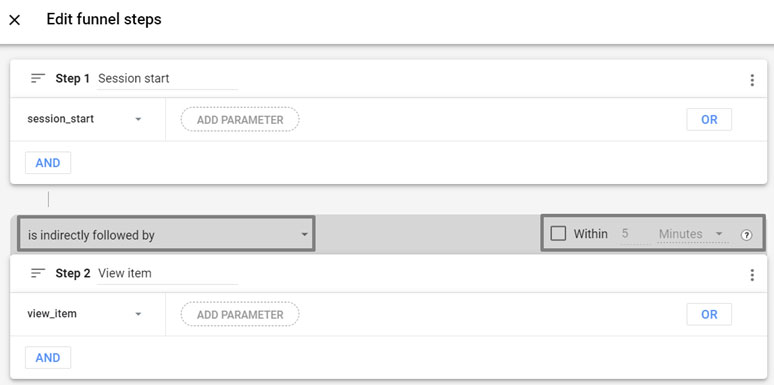
In the drop-down list on the left, you can select whether the second step must directly follow the first or not.
In the menu on the right-hand side, you can activate a checkbox and set the time frame in which users must take this step in order to be included in the funnel.
The other settings are identical to those for the first step. You can define different conditions with built-in and custom parameters as well as “And”/”Or” conditions.
For our e-commerce funnel, you can therefore select the view_item event as the second step.
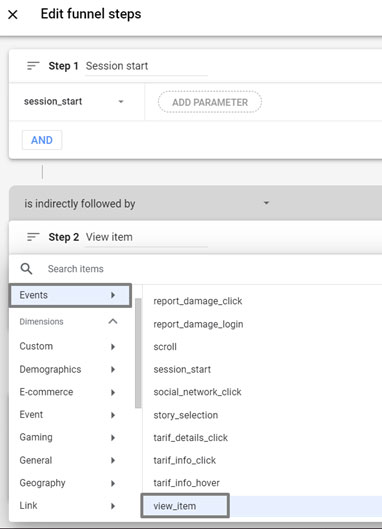
add_to_cart as the third step, begin_checkout as the fourth step and the purchase at the end.
Example of an e-commerce funnel in Google Analytics 4
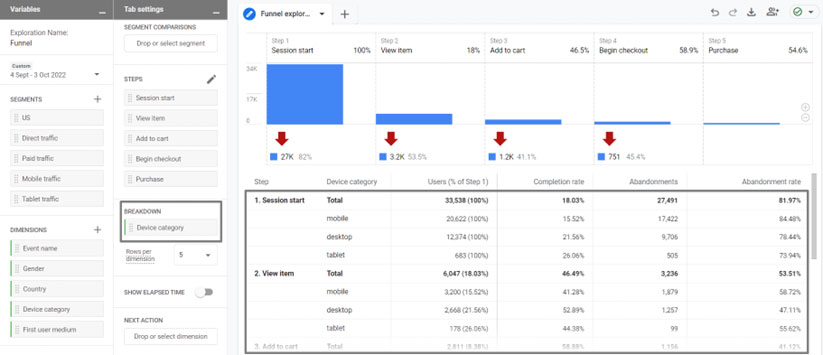
Now we can see how many visitors start a session on our website, see the product page (view_item event), how many of them add the product to the cart (add_to_cart), start the checkout process (begin_checkout) and finally make a purchase.
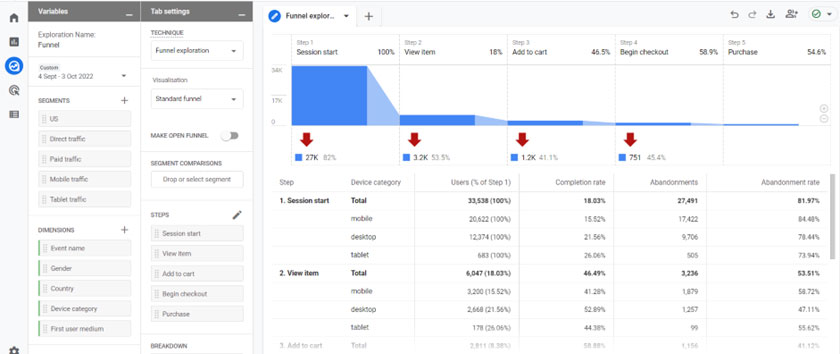
Below the red arrows we can see the aborts for each step, and near the step name we can see the percentage of users who move on to another step.
Table and explanation
In addition to the funnel chart, there is also a table at the end of the report. In this table, the absolute values, the completion rate and the abandonment rate are broken down by the breakdown dimension. By default, the breakdown is the device category, but you can remove this or add your own dimension.
Next step
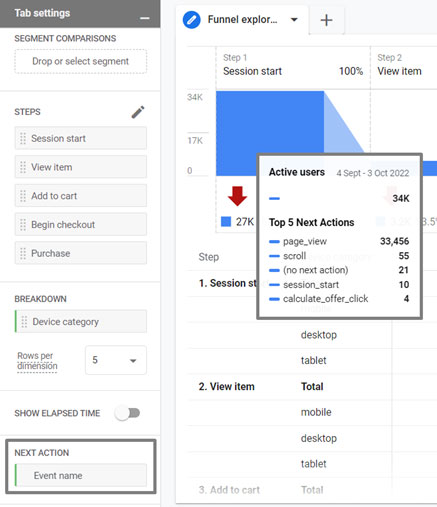
If you activate the “Next Action” function, some additional information is displayed in the report. If you move the mouse pointer over the bars in the diagram, you can analyze the 5 most important next events after the step.
Create an "open" funnel
Here you can flip the “Open Funnel” switch to open our funnel. What does this mean? In an open funnel, the user can enter the funnel at any step. In a closed funnel, the first step is mandatory and the user must follow the sequence of funnel steps.
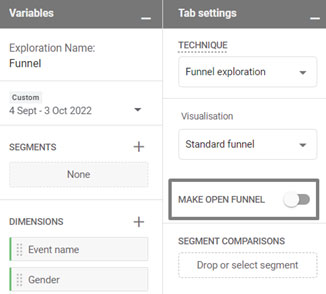
Depending on the position of this small switch, your funnel can therefore have a completely different appearance.
Show past time
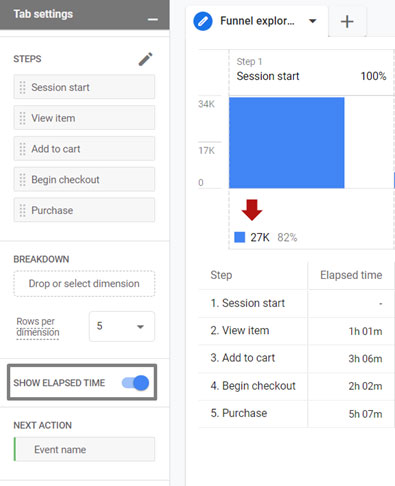
We can activate the “Show Elapsed Time” switch to display how much time users need for the individual steps.
Segments
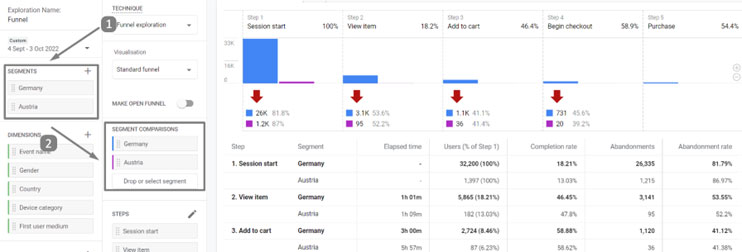
You can use up to four segments to analyze specific groups of users. There are some popular built-in segments and you can also create your own segments. The result is that the chart and table are split into the segments you have selected.
Filter
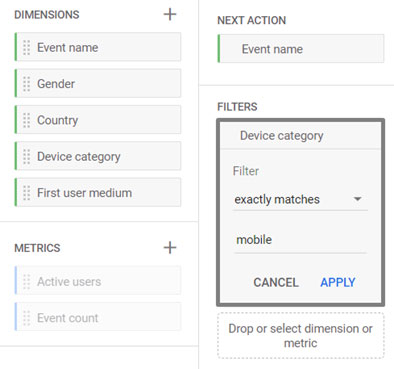
If you want to restrict data according to certain criteria, you can use filters.
Trended Funnel
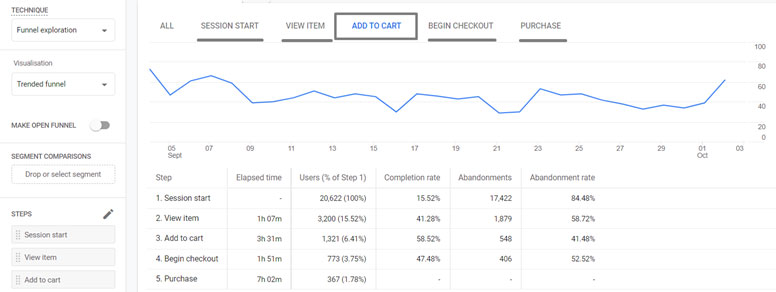
All screenshots shown below are examples of classic standard funnels. In GA4, however, you can also analyze how the data develops over time. You can switch from standard to trend funnels in the settings and the chart will display the data dynamically.

With a large number of steps, the diagram is not very clear, but you can switch between certain events and see them over time:
Some restrictions
Here are some limitations I’ve seen with this type of report in GA4:
- Metrics cannot be edited in the funnel report.
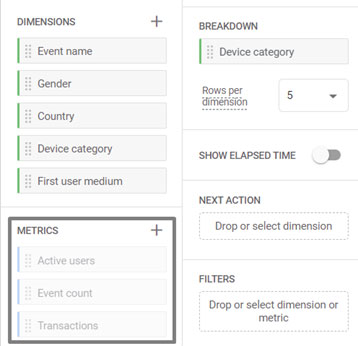
- Metrics cannot be edited in the funnel report.
