
In Power BI, slicers are dynamic and interactive visual filters that you can include to your reports. Consider them as a control panel that allows you to filter out the data displayed in various visuals within the report page.
To use Power BI slicers, you need to first drag & drop a field into the Slicers visualization from the Fields pane. Next, customize its interface and properties from the Format pane. In this pane you can adjust its orientation, single/multi-select options, and search box visibility. You can also interact with the slicer by selecting data items to filter other visuals in real-time on the report page based on the item selection in the slicer.
In this article you will learn how to create these slicers, when to use them, and cover some cool formatting options and important tips when it comes to syncing slicers across multiple pages in power bi reports. We’ll go through the steps with practical examples and use cases to help you understand better.
7 Types of Slicers & Steps to Create them in Power BI
Selecting a Power Bi Slicer totally depends on the type of data you are working with. Power Bi provides slicers specially designed to work with categorical data (like product names, product categories), numerical data(like no of items sold, sales figures), and date ranges.
The 7 types of slicers are:
- Button Slicers
- Lists Slicer
- Radio Button Slicer
- Hierarchy Slicers
- Dropdown & Hierarchy Slicers
- Range Slider Slicers
- Timelines Slicer
Step 1: Loading & setting up Data
Choose your data set: Select a familiar Excel workbook that consists of specific data you would like to work with. It may be sales figures, customer information, or anything you’d like to explore.
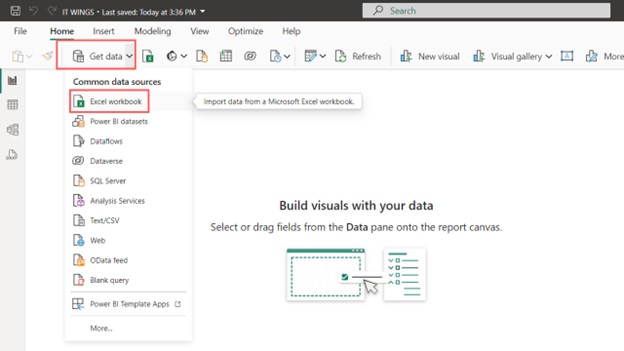
Import data into Power BI: In Power BI Desktop, click on “Get Data” from the dropdown, select “Excel Workbook.” This will direct you to your file explorer where you can choose your chosen Excel file.
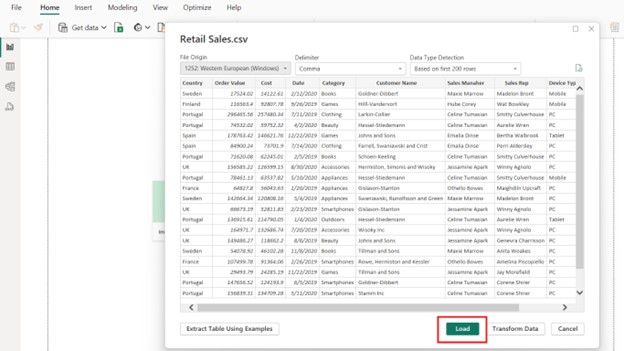
Next you can load and transform your data, Click on Load Data, by following these steps, you will have your data loaded into Power BI and ready to explore with slicers.
Step 2: Choosing Slicer Type
The next step is to choose which type of slicer you need to use in your reports. In the later section you will find the 6 types of slicers and their configuration steps inside power bi.
Type1: Button Slicer
Let’s start off with buttons. In Power BI Desktop, you can disguise your slicer to look like buttons. By using button slicers, you can quickly turn the typical filters into clickable buttons, making your dashboard dynamic and interactive.
This content is locked
Login To Unlock The Content!