Take your Power BI skills to the next level with us and learn the basic DAX formulas to get the most out of your data and solve business problems efficiently.
What is DAX and why is it important for Power BI?
All calculations you can perform in Power BI are driven by DAX (Data Analysis Expressions). Calculating a simple sum, or an average, or creating a visualization works without even touching DAX. These things are created automatically in the background. However, there are cases in which it is better to create a DAX formula yourself.
A custom DAX formula is the solution when complex or custom formulas need to be created where a simple sum or average would not suffice for the business problem to be solved.
If a formula is to be reused in multiple places, in multiple charts or as an expression in other DAX formulas, using a DAX formula would make a report more efficient and facilitate future changes. In such cases, only one formula needs to be changed instead of many in each place.
Where are DAX formulas used in Power BI?
There are 3 cases where DAX formulas are used:
- Creating a calculated table
- Creating a calculated column
- Creating a key figure
Instead of querying values and loading them from a data source into the columns of a new or existing table, a DAX formula can be created to define the values of the columns.
In Microsoft Excel under the “Modeling” tab, there are three options: Adding a new measure, a calculated column or a table. A new key figure, a calculated column or a table can be added.
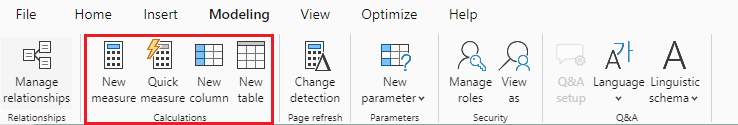
Alternatively, you can right-click on a table in the “Fields” area. The option to add a new key figure or a calculated column appears in the drop-down menu.
Write your own DAX formula
DAX formulas are intuitive and easy to read. This makes it easy to understand the basics of DAX so that you can start writing your own formula relatively quickly. Below are the building blocks of a proper DAX syntax.
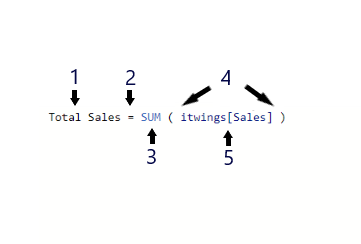
- Name of the key figure or the calculated column
- The equality operator indicates the start of the formula
- DAX function
- Opening (and closing) brackets
- Column and/or table references
Each subsequent parameter in a function is separated by a comma.
DAX functions can be nested within each other to perform multiple operations efficiently. This can save a lot of time when writing DAX formulas. For example, it is often useful to have several nested IF statements or to use the IFERROR function. This allows another function to be wrapped so that all errors in the formula are represented by a specified value. Some of the most commonly used DAX functions in reports are:
- Simple calculations: COUNT (DAX formula for number), SUM (DAX formula for sum), AVERAGE (DAX formula for mean value), MIN, MAX.
- SUMMARIZE: Outputs a summary table which is used for further aggregations across different groupings.
- CALCULATE: Performs an aggregation with one or more filters. If more than one filter is specified, the function performs the calculation if all filters are true.
- IF (IF): Returns a value based on a logical condition if it is true. Otherwise, a second value is returned.
- IFERROR (IF ERROR): Searches for errors for an inner function and returns a specific value.
- ISBLANK (ISTLEER): Checks whether the rows in a column are empty and returns "true" or "false".
- DATEDIFF: Specifies the difference between two dates (both as column references in date formats) in days, months, quarters, years, etc.
Context in DAX formulas
DAX formulas in Power BI are dynamic and change depending on the context in which they were created. It is important to understand how contexts work in DAX to be able to quickly correct errors in formulas.
There are two main types of contexts in DAX: row context and filter context.
Row context
The row context refers to the current row above all columns of a table and also extends to all columns of the related tables. With this type of context, the DAX formula knows which rows to use for a particular formula
An example of a formula that has a row context:
Cost per unit = itwings [cost of sales] / itwings [units sold]
In this example, the cost per unit is calculated row by row. This means that DAX needs to know what the current row is when it runs through the data set, performs the calculation and populates the new column with the result.
The row context is implicit in calculated columns. This is because the calculations performed in calculated columns are done row by row and the row context is therefore defined by default. However, this is not the case with key figures, as the aggregations are applied to all rows in a table. These calculations do not need to be aware of a current row as all rows are aggregated together.
An example of a key figure is the following DAX formula:
Profit margin = SUM (itwings[profit] ) / SUM (itwings[revenue] )
In this case, the entire profit column is totaled to obtain a single figure. This is divided by the sum of the entire Revenue column. DAX does not need to know the current row as it performs an aggregation. This key figure therefore has no row context.
To explicitly define a row context in a key figure, a special function, a so-called iterator, must be used. Examples of iterator functions are SUMX, AVERAGEX and COUNTX. These functions first perform a row-by-row calculation and then perform the final aggregation of the result (i.e. sum, average, count, etc.). In this way, the row context is explicitly defined by the use of these iterators.
An example of an iterator function:
Average cost per unit = AVERAGEX (itwings, itwings[cost of sales] / itwings[units sold] )
In this example, the expression (Cost of Sales / Units Sold) is first evaluated row by row and the result is then applied to the AVERAGE function. Another way to achieve the same result is to first create the calculated column ‘Cost per unit’ and then create a separate average calculation for this column. However, knowing when to use an iterator function can make reports more efficient and use less memory, as effectively two calculations can be performed with just one formula.
Filter context
A filter context is applied to a row context and refers to a subset of rows or columns that are specified as filters in the report. Filters can be applied in several ways:
- Directly in a DAX formula
- Using the filter area
- Using a data slice visualization
- Using the fields that make up a data visualization (e.g. the rows and columns in a matrix)
A good example is the use of the CALCULATE function, with which one or more filter parameters can be added to the key figure. In the following example, a key figure is created for the profit margin that is only filtered for Switzerland:
Switzerland Profit margin = CALCULATE (SUM (itwings[Profit] ) / SUM (itwings[Revenue] ), itwings[Country] = “Switzerland”)
Conclusion
This article has shown how to write a DAX formula for multiple columns and other tables in Power BI. These are just some of the basic functions that can be performed with DAX. DAX offers 250 possible functions, which are challenging to learn but worthwhile. To learn more about DAX, we recommend a course from Microsoft.